
Your application is slow. But where exactly? Is it the database query? The external API call? That one service that sometimes takes forever? Without proper observability, you're left guessing.
Today we're releasing @adonisjs/otel, a package that brings OpenTelemetry to AdonisJS with sensible defaults and zero-config setup.
The package is fully compatible with AdonisJS v6 and will also be compatible with the upcoming AdonisJS v7 release.
Why we built this
If you've ever tried to set up OpenTelemetry manually, you know it's not straightforward. Between the SDK initialization that must happen before anything else, the import-in-the-middle hook for auto-instrumentation, the various exporters and processors to configure, and the surprisingly complex APIs, it's easy to spend hours on setup before seeing a single trace.
We wanted something that just works. Run one command, get tracing. Then customize as needed.
node ace add @adonisjs/otelStart your app, make some requests, and see exactly what's happening inside.
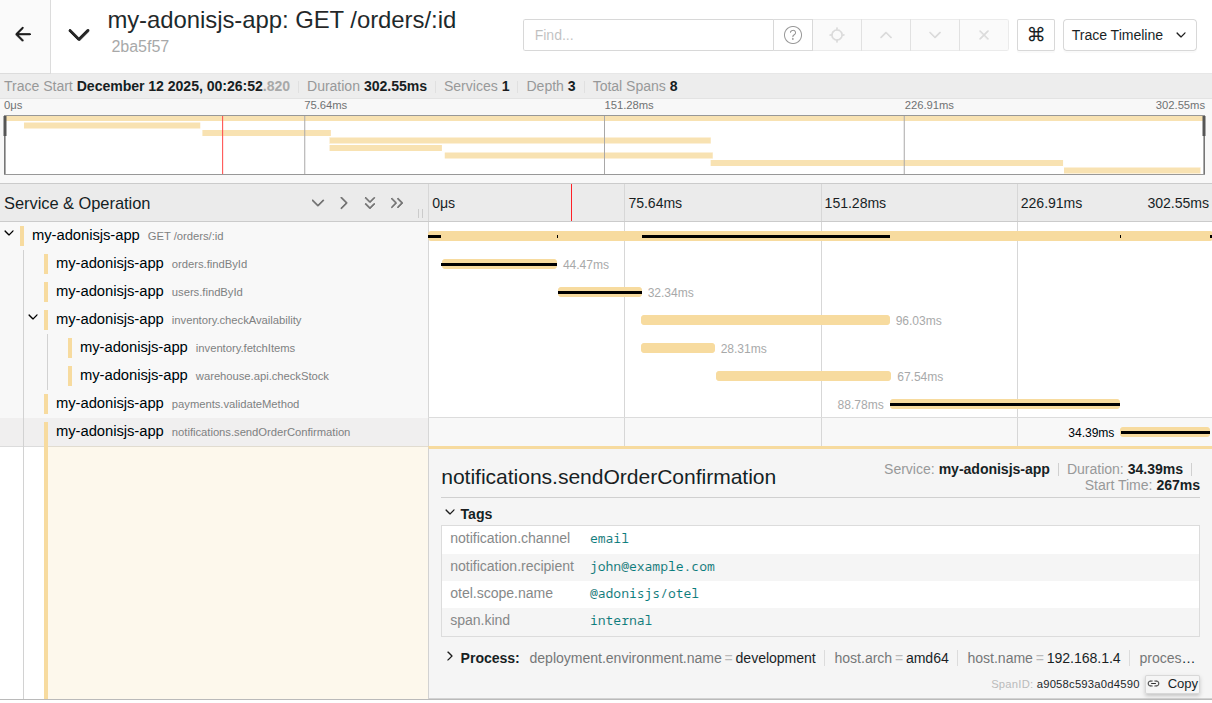
Every incoming request becomes a trace. Every database query, every Redis call, every external HTTP request becomes a span within that trace. You can see the exact timing of each operation and identify bottlenecks instantly.
What you get automatically
Out of the box, the package instruments:
- Incoming and outgoing HTTP requests
- Lucid database queries (via Knex)
- Redis operations
- And way more via OpenTelemetry's ecosystem
HTTP spans are automatically enriched with AdonisJS route information, so you see GET /users/:id instead of just GET. If you're using @adonisjs/auth, user context is attached to spans automatically.
Custom spans when you need them
For your own business logic, we provide simple helpers:
import { record } from '@adonisjs/otel/helpers'

const order = await record('order.process', async (span) => {
  span.setAttributes({ 'order.id': orderId })
  return await processOrder(orderId)
})
Or decorators ( for those who don't hate them ) :
import { span } from '@adonisjs/otel/decorators'

class OrderService {
  @span()
  async process(orderId: string) {
    // Span name: "OrderService.process"
  }
}
See the documentation for more details.
More than just traces
OpenTelemetry is built around three pillars: traces, metrics, and logs. @adonisjs/otel supports all three.
Logs are automatically captured from @adonisjs/logger. Every log entry is correlated with the current trace, so when you're investigating an issue, you can see exactly which logs were emitted during a specific request. No more grepping through log files trying to piece together what happened.
// Your code
logger.info('Processing order', { orderId: '123' })

// What gets exported (simplified)
{
  "body": "Processing order",
  "attributes": { "orderId": "123" },
  "traceId": "abc123...",
  "spanId": "def456..."
}
Metrics give you aggregated data about your application: request counts, error rates, response time distributions. These are exported alongside your traces to your observability backend. You can also create custom metrics:
import otel from '@adonisjs/otel/services/main'

const orderCounter = otel.createCounter('orders.processed', {
  description: 'Number of orders processed',
})

orderCounter.add(1, { status: 'success' })
Try it locally with Jaeger
Want to see traces without setting up a full observability stack? Jaeger is an open-source distributed tracing platform that lets you visualize and analyze traces directly in your browser. It's perfect for local development: you can see the full timeline of each request, inspect individual spans, and identify bottlenecks without needing to configure a paid observability service.
Jaeger runs in a single Docker container:
docker run -d --name jaeger \
  -p 16686:16686 \
  -p 4317:4317 \
  jaegertracing/all-in-one:latest
Then start your app, make a few requests, open http://localhost:16686 to explore your traces. You'll see every span, its duration, and how they relate to each other.
The performance cost
Let's be honest, observability isn't free. We ran benchmarks on a minimal "Hello World" route, and here's what we found:
| Metric | Without OTel | With OTel | Impact |
|---|---|---|---|
| Req/Sec | 39,165 | 18,649 | -52% |
| Latency (avg) | 25 ms | 53 ms | +112% |
| Latency (p99) | 52 ms | 83 ms | +60% |
Yes, that's a ~50% throughput reduction on a minimal route. The average latency roughly doubles. This is the cost of automatic instrumentation.
Before you panic: this is a worst-case scenario. A "Hello World" route does almost nothing, so the instrumentation overhead dominates. In real applications with actual database queries, business logic, and external calls, the relative overhead is much smaller. The point is: for most applications, even with a 50% reduction, you'll likely still have more than enough headroom for your production traffic.
Why is there overhead?
OpenTelemetry's auto-instrumentation uses
import-in-the-middle
, a library that hooks into Node.js's ESM loader to intercept module imports. When a module like pg or knex is loaded, its exports are wrapped with instrumentation code that creates spans around each operation.
This wrapping is where the cost comes from. Every instrumented call goes through additional code that:
- Creates a span object with metadata
- Captures timing information
- Records attributes and events
- Handles errors and status codes
- Queues the span for export
To give you a concrete idea, here's a simplified version of what auto-instrumentation does under the hood:
// The original library method
const originalGet = ioredis.prototype.get

// Monkey-patched to inject tracing
ioredis.prototype.get = function (key) {
  const span = tracer.startSpan('redis.get')
  span.setAttribute('db.statement', `GET ${key}`)

  try {
    const result = originalGet.call(this, key)
    span.end()
    return result
  } catch (error) {
    span.recordException(error)
    span.end()
    throw error
  }
}
This is essentially what happens for every instrumented library: pg, knex, ioredis, http, etc. The
OpenTelemetry JS contrib repository
contains dozens of these auto-instrumentations for popular Node.js libraries.
Also a common misconception is that AsyncLocalStorage (used for context propagation) is the main performance culprit. While it does have some overhead, it has improved significantly across Node.js versions. The real cost comes from the instrumentation wrappers themselves, not the context propagation.
The future looks brighter
The Node.js ecosystem is actively working on better solutions.
Diagnostic Channels: Node.js provides a built-in
diagnostics_channel
API, a pub/sub mechanism where libraries can emit diagnostic events without any external wrapping. Frameworks publish events at key points, and observability tools subscribe to them. No monkey-patching, no import interception.
We've already started experimenting with TracingChannel-based instrumentations in @adonisjs/otel. For example,
@adonisjs/fold
(our IoC container) exposes tracing channels for container instantiations:
// @adonisjs/fold - tracing_channels.ts
import { tracingChannel } from 'node:diagnostics_channel'

export const makeTracingChannel = tracingChannel('adonisjs.container.make')
export const makeContextualTracingChannel = tracingChannel('adonisjs.container.makeContextual')
Then, on the
@adonisjs/otel side
, we subscribe to these channels and create OpenTelemetry spans from them:
// @adonisjs/otel - container instrumentation
import { makeTracingChannel } from '@adonisjs/fold'

makeTracingChannel.subscribe({
  onStart(message, context) {
    context.span = tracer.startSpan(`container.make ${message.binding}`)
  },
  onEnd(_message, context) {
    context.span.end()
  },
})
This approach lets the framework emit tracing data directly, eliminating the need for external wrappers. However, this is still experimental, and we don't recommend relying on it for now. We'll share more as we iterate on this.
Build-time instrumentation: Projects like
orchestrion-js
take a different approach entirely. Instead of runtime wrapping, they use SWC (a Rust-based JavaScript compiler) to analyze your code's AST and inject TracingChannel calls at build time. The instrumentation becomes part of your compiled code, with zero runtime overhead from import interception.
Node.js already ships with built-in tracing channels for HTTP, DNS, NET, and other core modules. The TracingChannel API is still marked as experimental, but we'll be experimenting with it soon to see how much overhead we can shave off.
This applies to most observability vendors
If you're using any observability vendor with automatic instrumentation, you're paying this same cost. This includes Sentry, Datadog, and others. Sentry's tracing, for example, is built on OpenTelemetry auto-instrumentation under the hood. The overhead is inherent to how automatic instrumentation works in Node.js, not specific to any particular vendor or package.
Get started
Install the package and check out the documentation:
node ace add @adonisjs/otelThe tradeoff between observability and raw performance is real, but in our experience, knowing what's happening inside your application is worth far more than those extra milliseconds. When you're debugging a production issue at 2am, you'll be glad you have traces.
We'd love to hear your feedback. Try it out and let us know what you think!